
How many stocks were breaking out? Two years of one rule's Buy signals, month by month
2,421 Buy signals on 1,109 NSE stocks in 24 months: 19 in the quietest month, 373 in the busiest, 171 in one week in May 2026, two sessions before a 3.3% fall. The count follows the market and does not forecast it.
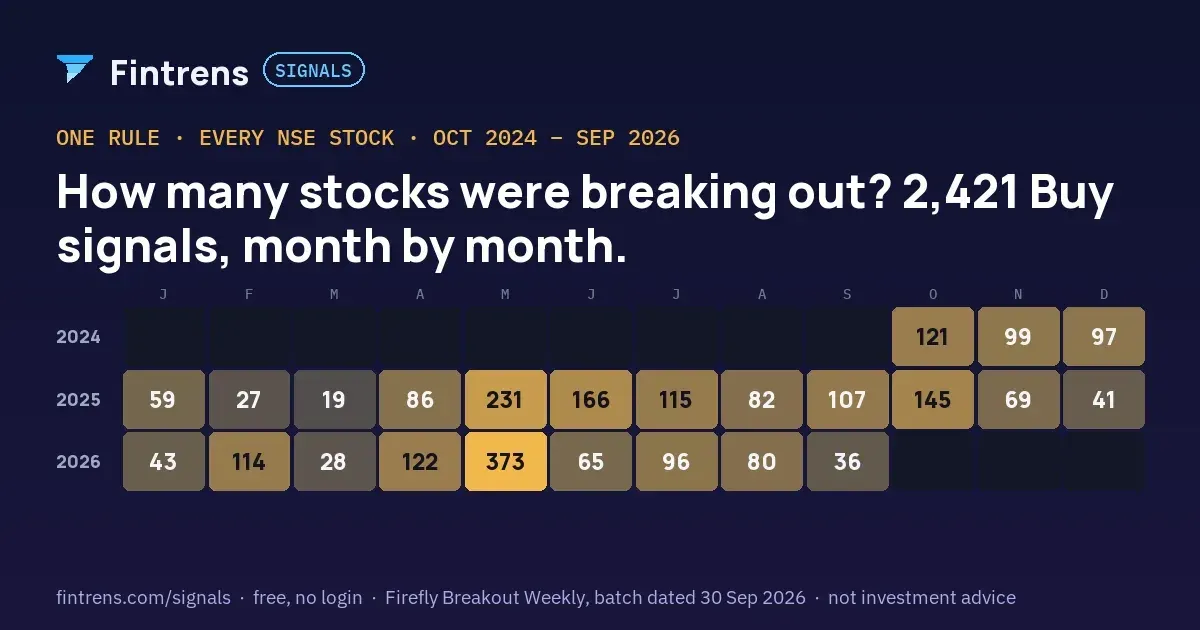
Every Buy signal on Fintrens Signals has a date. Put the dates of all of them on a calendar and you get a number nobody asks for and everybody should: how many NSE stocks were breaking out, month by month, by one fixed definition. This post is that calendar for Firefly Breakout Weekly, the rule the site publishes on every NSE stock, from the first day of its record, 1 October 2024, to the last day of the current batch, 30 September 2026.
The short answer: 2,421 Buy signals on 1,109 different stocks in 24 months, about a hundred a month, but almost never a hundred. The quietest month, March 2025, had 19. The busiest, May 2026, had 373, and 171 of those came in one week, 4 to 8 May. Two sessions after that week ended, the Nifty fell 3.3%, and 113 of the 171 went on to hit their stop. The month-by-month count turns out to say a lot about the market and almost nothing about what the market will do next, which is worth knowing before you read anything into it.
How it was counted
One Buy signal is one entry by the rule on one stock: a break above a recent high, checked weekly, with the exit later at a stop, a target or a trend reversal. The count here is the rule's entries on NSE stocks, by the month they were opened; 110 signals on ETFs are left out. The run behind the current batch covers 1,271 of the 2,374 NSE stocks listed on Signals, 1,109 of which were bought at least once; 162 were in the run for two years and never once met the definition. The stocks not in this run yet are the ones whose pages say "No trades yet". Of the 218 stocks in NSE's F&O list, 201 are in the run and 184 of those were bought.
"Closed above entry" counts the signals whose exit price was above the entry price, before costs. It is a count, not a return, and it is there to show how the same rule's signals ended in different months. The Nifty column is the index's close at the end of that month and its change over the month, from NSE.
The calendar
| Month | Nifty close | Nifty, month | Buy signals | Stocks | Ended at stop · target · reversal | Closed above entry | Median hold, days |
|---|---|---|---|---|---|---|---|
| Oct 2024 | 24,205.35 | -6.22% | 121 | 105 | 83 · 12 · 26 | 19 | 20 |
| Nov 2024 | 24,131.10 | -0.31% | 99 | 83 | 69 · 7 · 23 | 13 | 24 |
| Dec 2024 | 23,644.80 | -2.02% | 97 | 90 | 88 · 3 · 6 | 5 | 25 |
| Jan 2025 | 23,508.40 | -0.58% | 59 | 49 | 51 · 0 · 8 | 4 | 12 |
| Feb 2025 | 22,124.70 | -5.89% | 27 | 22 | 22 · 1 · 4 | 3 | 7 |
| Mar 2025 | 23,519.35 | +6.30% | 19 | 19 | 14 · 3 · 2 | 4 | 25 |
| Apr 2025 | 24,334.20 | +3.46% | 86 | 76 | 40 · 11 · 35 | 29 | 77 |
| May 2025 | 24,750.70 | +1.71% | 231 | 225 | 79 · 29 · 123 | 75 | 76 |
| Jun 2025 | 25,517.05 | +3.10% | 166 | 149 | 108 · 9 · 49 | 26 | 44 |
| Jul 2025 | 24,768.35 | -2.93% | 115 | 111 | 70 · 8 · 37 | 26 | 31 |
| Aug 2025 | 24,426.85 | -1.38% | 82 | 75 | 39 · 7 · 36 | 22 | 57 |
| Sep 2025 | 24,611.10 | +0.75% | 107 | 103 | 70 · 6 · 31 | 14 | 38 |
| Oct 2025 | 25,722.10 | +4.51% | 145 | 137 | 72 · 12 · 61 | 33 | 54 |
| Nov 2025 | 26,202.95 | +1.87% | 69 | 67 | 43 · 5 · 21 | 6 | 33 |
| Dec 2025 | 26,129.60 | -0.28% | 41 | 38 | 26 · 4 · 11 | 6 | 41 |
| Jan 2026 | 25,320.65 | -3.10% | 43 | 41 | 31 · 2 · 10 | 3 | 18 |
| Feb 2026 | 25,178.65 | -0.56% | 114 | 103 | 90 · 11 · 13 | 17 | 22 |
| Mar 2026 | 22,331.40 | -11.31% | 28 | 22 | 18 · 7 · 3 | 9 | 23 |
| Apr 2026 | 23,997.55 | +7.46% | 122 | 112 | 75 · 21 · 26 | 34 | 28 |
| May 2026 | 23,547.75 | -1.87% | 373 | 329 | 234 · 49 · 90 | 88 | 21 |
| Jun 2026 | 23,865.75 | +1.35% | 65 | 61 | 48 · 6 · 11 | 7 | 29 |
| Jul 2026 | 24,383.60 | +2.17% | 96 | 88 | 72 · 10 · 14 | 11 | 23 |
| Aug 2026 | 24,080.40 | -1.24% | 80 | 75 | 76 · 3 · 1 | 3 | 19 |
| Sep 2026 | 22,620.45 | -6.06% | 36 | 32 | 34 · 2 · 0 | 2 | 9 |
| 24 months | 2,421 | 1,109 distinct | 1,552 · 228 · 641 | 459 |
The first day of the record, 1 October 2024, carries 36 signals on its own: that is a backtest starting and finding every stock already above its level, not the market doing anything that day. From there the shape is the market's.
The quiet months are the falls
The Nifty peaked in late September 2024 and fell to 22,124.70 by the end of February 2025, about 14% from the September close. The rule's count went 121, 99, 97, 59, 27, 19 over those six months. In February and March 2025 it bought 46 stocks in total, and five of the seven weeks between 10 February and 28 March had five signals or fewer. A rule that needs a stock to clear a recent high does not find many when most stocks are making lows, so the count fell with the market and kept falling for a month after the index turned: March 2025 was up 6.3% on the index and the rule's quietest month.
It did the same thing twice more. In December 2025 and January 2026, with the Nifty just below its highs and drifting, the rule bought 41 and 43 stocks, the two quietest months since early 2025. In March 2026, when the Nifty fell 11.3%, it bought 28. In September 2026, down 6.1%, it bought 36, and the week of 14 September is the only week in two years with no signal at all. When the rule is quiet, it is because few stocks are at highs. That is the honest reading of a low number, and it is the only reading: a quiet month was followed by a rally in April 2025 and by another leg down in September 2026.
The loud months come after the turn
The two busiest stretches of the record are a year apart and both come a few weeks after the index bottomed. The Nifty jumped 3.8% on 12 May 2025 and closed above 25,000 three days later for the first time since October 2024. The rule, which had bought 86 stocks in April, bought 231 in May and 166 in June, with 58, 74, 74 and 62 signals in the four weeks from 12 May. In 2026 the Nifty fell 11.3% in March and rose 7.5% in April; the rule bought 122 stocks in April and 373 in May, 55 of them on 1 May, 55 more on 4 May, and 171 in the week of 4 to 8 May, the busiest week of the record by a wide margin.
What happened next is the reason to be careful with the count. After the May 2025 burst the market kept going: the Nifty rose 3.1% in June, and of May 2025's 231 signals, 123 ended on a trend reversal, 79 at the stop and 29 at the target, with 75 closing above their entry and a median hold of 76 days. The May 2026 burst ran straight into a fall. The Nifty closed at 24,176 on Friday 8 May and at 23,380 on Tuesday 12 May, and of the 171 signals from that week, 113 hit the stop, 93 of them before the month was out; 38 closed above their entry and the median hold was 15 days. Same rule, same kind of week, the same sort of cluster of stocks clearing their highs after a bounce, and one cluster rode for two months while the other was stopped out in two weeks. The count was high both times. It did not know which kind of May it was in.
February 2026 is the smaller version of the same lesson. The Nifty was flat on the month, down 0.56%, and the rule bought 114 stocks, its busiest month since October. Then March fell 11.3%, and 90 of the 114 ended at the stop, 56 of them in March. A high count in a month that turns out to be the top is the rule buying breakouts that fail, in bulk, and it cannot be told apart in advance from a high count in a month that turns out to be the start of a run.
The count does not follow the index
Add it up by the direction of the index and the month's direction barely moves it: 1,106 signals in the ten months the Nifty rose, about 110 a month, and 1,315 in the fourteen it fell, about 94 a month. The rule's count is not a bet on the month's direction and does not track it. It tracks how many individual stocks were clearing their recent highs, which is a breadth reading of a very specific kind, lagged by the time it takes a stock to set a high and then clear it. It rises after rallies begin and collapses in falls, and the biggest readings are the ones that tell you the least about the next month: one of the two record months was followed by a 3.1% rise, the other, within two sessions, by a 3.3% fall.
Who got bought
The 1,109 stocks split by how often: 386 were bought once in two years, 373 twice, 202 three times, 92 four times and 56 five times or more. The most-bought stock is Commercial Syn Bags, nine signals, then Aeroflex Industries with eight and six names with seven: Centum Electronics, Kamat Hotels, Kronox Lab Sciences, Precision Wires, Quality Power and Rico Auto. None is a large cap. A stock that gets bought seven times in two years is one that keeps setting and clearing new highs and keeps giving the rule a reason to leave; the record of each, every entry and exit with its date, is on its page.
Across all 2,421 signals, 1,552 ended at the stop, 641 on a trend reversal and 228 at the target, and 459 closed above their entry. Those are the rule's two-year proportions, and the calendar above is what they look like spread over time: the targets cluster in May 2025 and May 2026, the stops in the months that followed a top.
What to do with the number
Read it as a description, not a forecast. When the current batch is replaced by one that includes October and November 2026, a stretch in which the Nifty is up about 12% from its October close and Bank Nifty has set a record, the calendar will almost certainly show another loud month. That will mean what it has meant twice before: a lot of stocks cleared their highs after the index turned. It will not say whether the month after is June 2025 or May 2026, because on this record it never has. The rule will buy them anyway, with a stop beside each entry, and the pages will show every one.
The calendar re-runs when the batch does. Until then the full record behind every number here is on Signals: the NSE stocks the rule tracks, the signal log with every event by date, and each stock's own page, free, no login.
Further reading
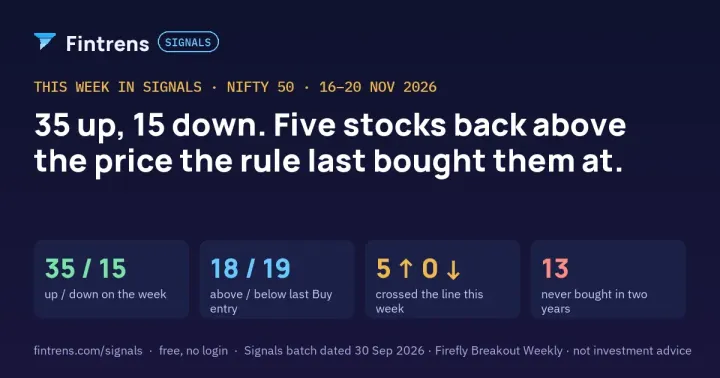
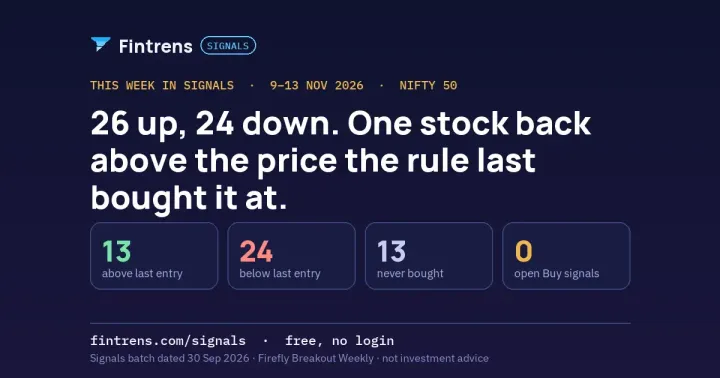
- This week in Signals, 20 November: the Nifty 50 against the rule, 18 above and 19 below their last entry.
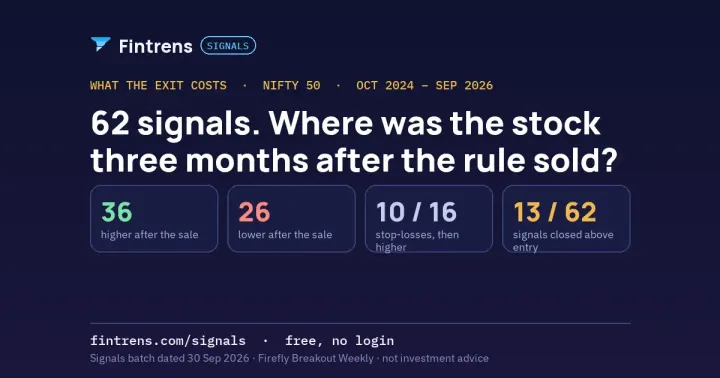
- What the exit costs: 62 Nifty 50 signals, three months after the rule sold.
- The Buy zone: every stock with an open Buy signal in the current batch.
Sources: Firefly Breakout Weekly's refined backtest log, 1 October 2024 to 30 September 2026, as published on Fintrens Signals; Nifty 50 month-end closes and daily closes from NSE, cross-checked with Yahoo Finance. Outcomes are simulated by applying Firefly's rule to historical prices, before costs and slippage; "closed above entry" is a count of signals, not a return. Educational information, not investment advice. Fintrens is a software company, not a SEBI-registered investment adviser.