
What the exit costs: 62 Nifty 50 signals, three months after the rule sold
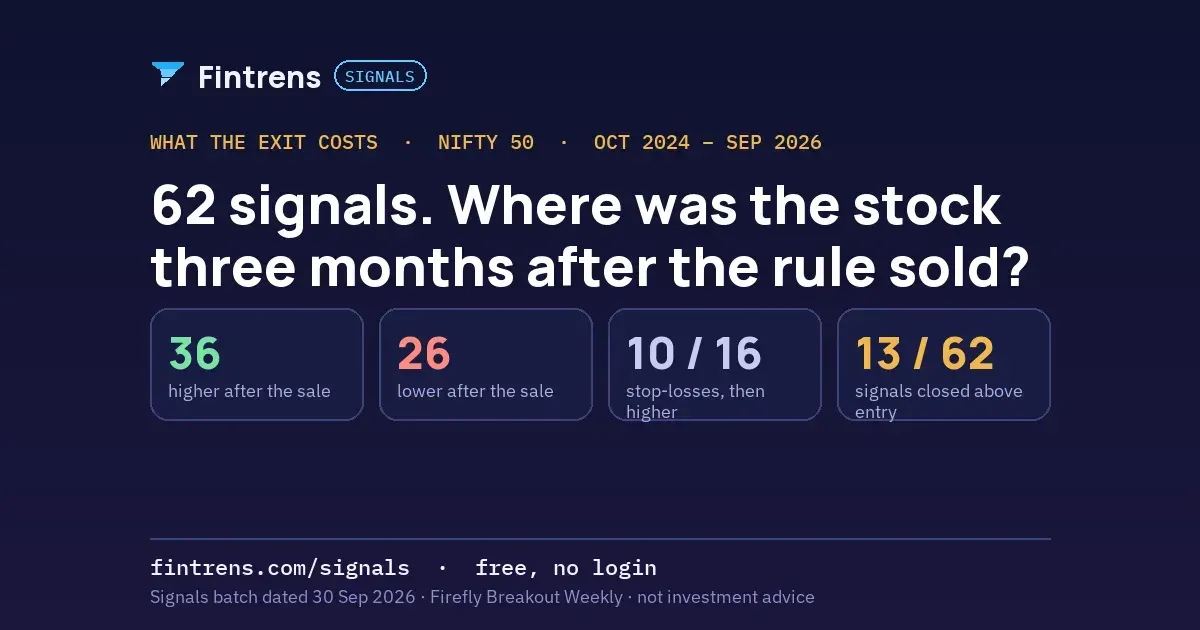
After Firefly's weekly breakout rule sold a Nifty 50 stock, where was the stock three months later? 62 exits since October 2024: 36 higher, 26 lower, and the stop-loss followed by a rebound ten times in sixteen.
Every backtest report prints the trades. Almost none prints what the stock did after the rule sold it. That number is the one a reader actually wants when a stop-loss fires, because the fear is never "the trade lost money"; it is "the rule sold at the bottom and the stock went straight back up". So here it is, for one rule, one index, two years, every exit.
Fintrens Signals publishes what Firefly Breakout Weekly, one of Firefly's rule-based strategies, sees on 2,720 NSE stocks and ETFs: every Buy signal since October 2024 with its entry, exit and reason, including the losing ones. This note takes the Nifty 50 constituents, every Buy signal the rule closed between October 2024 and the 30 September 2026 batch, and asks one question of each: three months after the rule sold, where was the stock?
How it was measured
Seventy-one Buy signals on Nifty 50 stocks were opened and closed in the log. Nine of them sold after mid-August 2026 and do not yet have three months of history, so the set is the 62 that do. "Three months" is 63 NSE sessions after the exit day, read from the daily closes that the Signals pages use. The after-sale move is that close against the price the rule sold at. It is not a trade and nobody earned or lost it: it measures what the exit rule gave up, or avoided. "How the signal closed" is the simulated outcome of the signal itself, entry to exit, before costs.
The rule sells for two reasons only. A stop-loss, placed at entry and never moved, roughly ten percent below the entry price. Or a trend-reversal candle, a weekly bar whose shape says the move it bought has ended. Sixteen of the 62 sales were stops, 46 were reversals.
The answer: 36 higher, 26 lower
Three months after the rule sold, the stock was higher in 36 of 62 cases and lower in 26. The median move was +3.2%. That is the exit's cost in one line: more often than not, the stock the rule had just sold went on to rise, and by a little.
Split by the reason for selling, the stops look worse than the reversals, which is what you would expect of a rule that sells into a fall. After the 16 stop-losses the stock was higher ten times and lower six, median +6.8%. After the 46 reversal exits it was higher 26 times, lower 20, median +1.5%. So the stop, the exit everyone fears, was followed by a rebound in ten cases out of sixteen. The other six are the ones that paid for it, and two of them are at the bottom of the table.
Set the signal's own result beside the after-move and four groups appear. 8 signals closed above entry and the stock kept rising: the rule left money on the table but had already taken some. 5 closed above entry and the stock then fell: the exit was right. 28 closed below entry and the stock then rose: the painful group, 28 of 62, and the reason this note exists. 21 closed below entry and the stock kept falling: the stop did its job. Put the first and third together and the stock rose after 36 sales; put the second and fourth together and it fell after 26. Only 13 of the 62 signals closed above their entry at all, which is the shape of a breakout rule on large caps in a range: many small losses, a few long holds. The median hold was 86 days; the winners were held a median 154 days, the losers 71.
The five biggest runs after the sale
Tata Steel: sold 24 Nov 2025 at ₹166 on a reversal candle, the signal closed −4.1%; three months later the stock was +25.4% above the sale price. Bajaj Finance: sold 28 Jul 2025 at ₹885.65, a signal that had closed +16.6%; the stock went another +20.0%. Tata Consumer Products: a −10.2% stop on 3 Mar 2025, then +17.1%. SBI Life Insurance Company: sold 1 Oct 2025, signal +2.6%, then +16.9%. Bajaj Auto: a −10.1% stop on 29 Jun 2026, then +16.6%. Three of the five are stops, and all three were followed by a rise of a sixth or more. That is the cost, and it is real.
The five biggest falls avoided
HCL Technologies: sold 6 Feb 2026 at ₹1,578.5, the signal closed −0.6%, almost flat; three months later the stock was −28.8%. Wipro: a −10.0% stop on 14 Jan 2025, then −17.7%. Wipro, a year later: another −10.0% stop on 20 Jan 2026, then −14.7%. Bajaj Finance: sold 31 Dec 2025 at −1.0%, then −13.3%. Nestlé India: sold 16 Oct 2024 at −8.5%, then −11.8%. HCL Tech is the single most valuable exit in the set: a signal that made nothing, followed by a fall of nearly thirty percent that the rule was not in for. Wipro twice is the stop earning its keep on the same stock a year apart.
All 62, three months after the sale
Sorted by what the stock did after the rule sold it, best to worst. Every stock links to its Signals page, where the full record is, including the signals too recent to be in this table.
| Stock | Buy signal | Sold | Why it sold | How the signal closed | Stock, three months after the sale |
|---|---|---|---|---|---|
| Tata Steel | 3 Oct 2025 at ₹173.17 | 24 Nov 2025 at ₹166 | Trend reversal | −4.1% | +25.4% |
| Bajaj Finance | 6 Jan 2025 at ₹759.83 | 28 Jul 2025 at ₹885.65 | Trend reversal | +16.6% | +20.0% |
| Tata Consumer Products | 1 Feb 2025 at ₹1,061 | 3 Mar 2025 at ₹953.05 | Stop-loss | −10.2% | +17.1% |
| SBI Life Insurance Company | 25 Apr 2025 at ₹1,723.5 | 1 Oct 2025 at ₹1,769.1 | Trend reversal | +2.6% | +16.9% |
| Bajaj Auto | 8 May 2026 at ₹10,755 | 29 Jun 2026 at ₹9,672 | Stop-loss | −10.1% | +16.6% |
| Nestlé India | 17 Oct 2025 at ₹1,311.6 | 5 Mar 2026 at ₹1,238 | Trend reversal | −5.6% | +16.2% |
| JSW Steel | 21 Mar 2025 at ₹1,056.5 | 7 Apr 2025 at ₹906 | Stop-loss | −14.2% | +14.8% |
| Oil & Natural Gas Corporation | 7 Oct 2025 at ₹249.25 | 8 Dec 2025 at ₹238 | Trend reversal | −4.5% | +13.1% |
| Hindalco Industries | 12 Sep 2025 at ₹754.3 | 23 Mar 2026 at ₹855 | Trend reversal | +13.4% | +12.7% |
| Titan Company | 7 Jan 2026 at ₹4,305 | 29 Jan 2026 at ₹3,871.4 | Stop-loss | −10.1% | +12.6% |
| Tata Steel | 20 Mar 2025 at ₹160.09 | 4 Apr 2025 at ₹143.97 | Stop-loss | −10.1% | +12.5% |
| Axis Bank | 16 Apr 2025 at ₹1,125 | 18 Jul 2025 at ₹1,090 | Trend reversal | −3.1% | +12.5% |
| Eicher Motors | 1 Feb 2025 at ₹5,334.6 | 13 Feb 2025 at ₹4,800.1 | Stop-loss | −10.0% | +12.2% |
| Bajaj Auto | 1 Sep 2025 at ₹9,009.5 | 13 Mar 2026 at ₹9,006 | Trend reversal | −0.0% | +11.9% |
| Maruti Suzuki | 29 Jan 2025 at ₹12,232.2 | 17 Mar 2025 at ₹11,461.05 | Trend reversal | −6.3% | +11.7% |
| Axis Bank | 23 Oct 2025 at ₹1,249.8 | 13 Mar 2026 at ₹1,218.6 | Trend reversal | −2.5% | +11.6% |
| Titan Company | 15 May 2025 at ₹3,657.3 | 31 Jul 2025 at ₹3,340 | Trend reversal | −8.7% | +11.5% |
| Bharat Electronics | 22 May 2025 at ₹386.25 | 20 Aug 2025 at ₹375.45 | Trend reversal | −2.8% | +10.9% |
| Adani Ports and Special Economic Zone | 28 May 2025 at ₹1,427 | 7 Aug 2025 at ₹1,331.1 | Trend reversal | −6.7% | +10.8% |
| Adani Ports and Special Economic Zone | 16 Oct 2025 at ₹1,485 | 12 Jan 2026 at ₹1,422.8 | Trend reversal | −4.2% | +10.6% |
| Hindalco Industries | 7 Mar 2025 at ₹693.9 | 4 Apr 2025 at ₹622.7 | Stop-loss | −10.3% | +10.1% |
| Tata Consumer Products | 24 Apr 2025 at ₹1,159.9 | 23 Jul 2025 at ₹1,055.6 | Trend reversal | −9.0% | +9.4% |
| Bajaj Finserv | 3 Feb 2025 at ₹1,796.05 | 1 Aug 2025 at ₹1,919 | Trend reversal | +6.8% | +8.0% |
| Adani Ports and Special Economic Zone | 4 May 2026 at ₹1,702 | 29 Jul 2026 at ₹1,742 | Trend reversal | +2.4% | +7.5% |
| Eicher Motors | 1 Sep 2025 at ₹6,132 | 2 Feb 2026 at ₹6,805 | Trend reversal | +11.0% | +7.3% |
| JSW Steel | 23 Sep 2025 at ₹1,130 | 9 Dec 2025 at ₹1,099.3 | Trend reversal | −2.7% | +7.2% |
| Bharat Electronics | 1 Feb 2026 at ₹458 | 1 Feb 2026 at ₹410 | Stop-loss | −10.5% | +7.2% |
| Eicher Motors | 12 Feb 2026 at ₹7,849.5 | 12 Mar 2026 at ₹7,050 | Stop-loss | −10.2% | +6.5% |
| Grasim Industries | 15 Apr 2025 at ₹2,720 | 6 Nov 2025 at ₹2,699.2 | Trend reversal | −0.8% | +6.1% |
| HDFC Bank | 17 Apr 2025 at ₹943.2 | 28 Aug 2025 at ₹957.2 | Trend reversal | +1.5% | +5.3% |
| Apollo Hospitals Enterprise | 1 Jul 2025 at ₹7,569.5 | 19 Nov 2025 at ₹7,340 | Trend reversal | −3.0% | +4.2% |
| Tata Consumer Products | 17 Oct 2025 at ₹1,169.5 | 28 Jan 2026 at ₹1,129 | Trend reversal | −3.5% | +2.2% |
| Trent | 6 May 2026 at ₹4,312.4 | 29 May 2026 at ₹2,840 | Stop-loss | −34.1% | +1.4% |
| Max Healthcare Institute | 16 Jun 2025 at ₹1,245.2 | 28 Aug 2025 at ₹1,152.4 | Trend reversal | −7.5% | +0.9% |
| Sun Pharmaceutical | 19 Nov 2025 at ₹1,783.1 | 16 Jan 2026 at ₹1,666.3 | Trend reversal | −6.6% | +0.8% |
| HDFC Life Insurance Company | 25 Apr 2025 at ₹731.6 | 4 Aug 2025 at ₹732.15 | Trend reversal | +0.1% | +0.5% |
| Max Healthcare Institute | 17 Dec 2024 at ₹1,199 | 13 Jan 2025 at ₹1,078.1 | Stop-loss | −10.1% | −0.1% |
| Bharat Electronics | 3 Feb 2026 at ₹460 | 23 Mar 2026 at ₹413.6 | Stop-loss | −10.1% | −0.5% |
| ICICI Bank | 1 Apr 2025 at ₹1,339.55 | 28 Aug 2025 at ₹1,403 | Trend reversal | +4.7% | −1.0% |
| Tech Mahindra | 25 Nov 2024 at ₹1,767.8 | 3 Feb 2025 at ₹1,605.15 | Trend reversal | −9.2% | −2.0% |
| UltraTech Cement | 3 Jul 2025 at ₹12,570 | 26 Sep 2025 at ₹12,061 | Trend reversal | −4.0% | −3.0% |
| Hindustan Unilever | 11 Jul 2025 at ₹2,517.8 | 3 Nov 2025 at ₹2,442 | Trend reversal | −3.0% | −3.0% |
| Hindalco Industries | 25 May 2026 at ₹1,119.8 | 16 Jun 2026 at ₹990 | Stop-loss | −11.6% | −3.2% |
| UltraTech Cement | 23 Jan 2026 at ₹12,462 | 9 Mar 2026 at ₹11,551 | Trend reversal | −7.3% | −3.8% |
| SBI Life Insurance Company | 4 Nov 2025 at ₹1,984.7 | 1 Feb 2026 at ₹1,950.2 | Trend reversal | −1.7% | −4.0% |
| Tata Steel | 29 Jan 2026 at ₹198.9 | 23 Jun 2026 at ₹193.05 | Trend reversal | −2.9% | −4.2% |
| Tech Mahindra | 4 Dec 2025 at ₹1,570.8 | 13 Feb 2026 at ₹1,482.6 | Trend reversal | −5.6% | −4.2% |
| NTPC | 5 Jan 2026 at ₹353.9 | 10 Jun 2026 at ₹351.7 | Trend reversal | −0.6% | −5.9% |
| Coal India | 2 Jan 2026 at ₹409.85 | 27 May 2026 at ₹429 | Trend reversal | +4.7% | −5.9% |
| Power Grid Corporation of India | 4 Feb 2026 at ₹289.65 | 2 Jun 2026 at ₹281.75 | Trend reversal | −2.7% | −6.5% |
| Eternal | 22 Jul 2025 at ₹293 | 6 Nov 2025 at ₹306.8 | Trend reversal | +4.7% | −6.5% |
| Asian Paints | 13 Nov 2025 at ₹2,858.9 | 27 Jan 2026 at ₹2,638.6 | Trend reversal | −7.7% | −7.2% |
| Bharti Airtel | 17 Apr 2025 at ₹1,847.8 | 16 Jan 2026 at ₹1,992.1 | Trend reversal | +7.8% | −7.6% |
| Bajaj Finserv | 20 Oct 2025 at ₹2,118.3 | 20 Jan 2026 at ₹1,952.2 | Trend reversal | −7.8% | −9.2% |
| Tata Consumer Products | 11 May 2026 at ₹1,241.4 | 8 Jun 2026 at ₹1,115 | Stop-loss | −10.2% | −9.4% |
| Maruti Suzuki | 18 Aug 2025 at ₹13,990 | 27 Jan 2026 at ₹15,300 | Trend reversal | +9.4% | −11.2% |
| Oil & Natural Gas Corporation | 28 Jan 2026 at ₹269.5 | 2 Jun 2026 at ₹261.2 | Trend reversal | −3.1% | −11.3% |
| Nestlé India | 1 Oct 2024 at ₹1,345 | 16 Oct 2024 at ₹1,230.03 | Trend reversal | −8.5% | −11.8% |
| Bajaj Finance | 1 Oct 2025 at ₹991.5 | 31 Dec 2025 at ₹981.2 | Trend reversal | −1.0% | −13.3% |
| Wipro | 19 Dec 2025 at ₹267 | 20 Jan 2026 at ₹240.25 | Stop-loss | −10.0% | −14.7% |
| Wipro | 20 Dec 2024 at ₹320 | 14 Jan 2025 at ₹288 | Stop-loss | −10.0% | −17.7% |
| HCL Technologies | 12 Nov 2025 at ₹1,588 | 6 Feb 2026 at ₹1,578.5 | Trend reversal | −0.6% | −28.8% |
Closes are the NSE close via Yahoo Finance; the Signals pages carry the same closes. Signals as of the 30 September 2026 batch. Nine Nifty 50 signals closed between 31 August and 30 September 2026 and will join this table when they have three months of history.
What to do with the number
Nothing, on its own. The after-sale move is not a return anyone earned, and a rule that was re-tuned to hold through the 28 rebounds would also have held through the HCL Tech fall and both Wipro falls. What the table does settle is a factual question people usually argue from memory: after this rule sells a Nifty 50 stock, the stock rises more often than it falls, by a small median, and the stop is followed by a rebound ten times in sixteen. If you are going to use a breakout rule on large caps, that is the cost you are agreeing to pay, and the page it is on should say so. Ours does, and will say so again with the next batch.
Sources: Firefly backtest log, Firefly Breakout Weekly, NSE cash equities, Nifty 50 constituents as of November 2026, signals opened from 1 October 2024 and closed by 30 September 2026; daily NSE closes via Yahoo Finance to 13 November 2026.
Fintrens Technologies is a software company, not a SEBI-registered investment adviser or research analyst. Signals publishes the output of a rule-based strategy from a backtest; results are simulated, before costs, and do not indicate future performance. Nothing here is a recommendation to buy or sell any security. Trading in equities involves risk of loss.
Further reading on fintrens.com
- Nifty 50 on Signals: every constituent and its verdict
- Which NSE stocks are in the buy zone today
- How Firefly's strategies and their risk limits work
- What a backtest can and cannot tell you
- This week in Signals, 13 November: 26 up, 24 down
- Why a breakout rule has never bought Reliance, TCS or Infosys in two years